Market volatility and pantry loading subsiding, industry growth shifting back toward historic trends according to Organic Trade Association’s latest Industry Survey
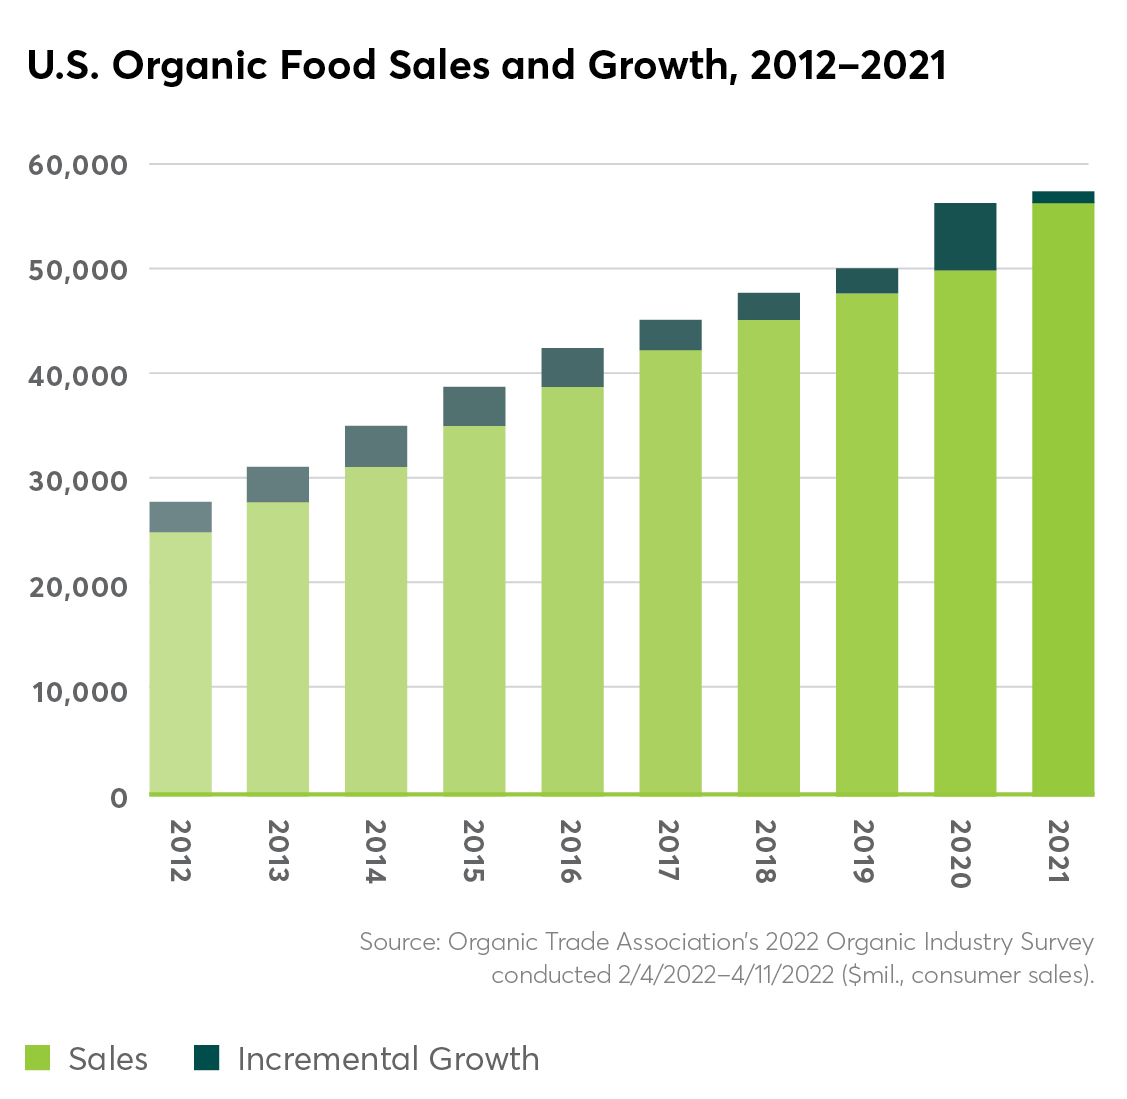
Following an unprecedented year marked by pantry loading and supply shortages, the Organic Trade Association’s (OTA) latest Organic Industry Survey shows consumers returned to more stable, buy-as-you-need shopping patterns in 2021. Between 2020 and 2021, organic sales surpassed $63 billion, with $1.4 billion (2 percent) total growth over the year. Food sales, which comprise over 90 percent of organic sales, rose to $57.5 billion (roughly 2 percent growth), and non-food sales reached $6 billion in sales (7 percent growth).
“Like every other industry, organic has been through many twists and turns over the last few years, but the industry’s resilience and creativity has kept us going strong,” says OTA CEO and Executive Director Tom Chapman, “In 2020, organic significantly increased its market foothold as Americans took a closer look at the products in their home and gravitated toward healthier choices. When pandemic purchasing habits and supply shortages began to ease in 2021, we saw the strongest performance from categories that were able to remain flexible, despite the shifting landscape. That ability to adapt and stay responsive to consumer and producer needs is a key part of organic’s continued growth and success.”
Fruits & Vegetables
Organic fruits and vegetables accounted for 15 percent of the total product market and brought in over $21 billion in revenue in 2021; an approximately 4.5 percent increase over 2020. Fresh produce and dried beans, fruits, and vegetables drove growth in the category, showing 6 and 6.5 percent growth over the year, respectively. Frozen and canned foods declined slightly as consumers reduced pantry loading. Packaging on produce has increased since the beginning of the pandemic, as some shoppers perceived that it might better protect food from airborne viruses. It is yet unclear if this trend will continue, however, as organic food shoppers historically have preferred less packaging and plastic use.
Dairy, Eggs, and Meat
As any American will remember, staples like milk and eggs were among the first things to vanish off the shelves at the beginning of the pandemic. After hitting the highest growth rate in over a decade in 2020, the organic dairy and egg category unsurprisingly leveled off in 2021 as supply scares became less frequent. A tight market for organic feed and challenging international supply chains contributed to higher prices and lower total sales. Although organic dairy and eggs sales remained relatively flat through 2021, the category still outperformed 2019 sales by nearly 11 percent.
Despite unique supply chain constraints and the strict rules for raising organic poultry, livestock, and seafood, organic meat sales increased in 2021 by 2.5 percent, representing nearly $2 billion in annual sales. Organic poultry was the strongest performer in this category, with 4.7 percent growth and over $1 billion in sales.
Organic dairy, eggs, and meat are likely to be further bolstered by the recently finalized Origin of Livestock (OOL) rule and the pending Organic Livestock Poultry Standards (OLPS) proposed rule. The passage of OOL was celebrated by OTA and leaders from across the industry after 18 years of hard-fought advocacy. The rule clarifies the standards for transitioning dairy livestock to organic milk production and will create a more level playing field for all organic dairy producers. Organic livestock and poultry producers are also eagerly awaiting the OLPS rule, which would update animal welfare regulations – particularly for organic egg laying chickens – to bring all organic production more in-line with consumer expectations and best practices. OLPS addresses largely the same issues as theOrganic Livestock Poultry Practices final rule, which was struck down by the Trump Administration. OTA sued USDA in 2017 over the removal of this rule and litigation is still pending.
Packaged and Prepared Foods, Snacks
Packaged and prepared organic foods experienced an overall decline of around 5 percent in 2021, representing a shift away from pantry loading and toward more measured purchasing patterns. The sub-categories that saw the most significant growth spikes in 2020 – canned soups, nut butters, and pasta sauces – consequently saw the largest decreases in 2021. Organic baby food, which saw over 11 percent growth ($1.2 billion in sales) was the biggest bright spot in the packaged and prepared category in 2021. Baby food has traditionally been a strong point of entry for shoppers new to organic, and the sub-category has continued to be a notable innovator.
Snacks, the only organic category to contract in 2020, saw healthy growth of six percent ($3.3 billion in sales). With offices, gyms, schools, and many other destinations reopening, more and more Americans began looking for healthy, organic foods on the go. Nutrition bars made the most headway in this category, with nearly 15 percent growth and over $1 billion in sales.
Beverages
Organic beverages experienced strong growth (8 percent, the highest of all major categories) over 2021 thanks to the category's ability to remain nimble and adjust quickly to shifting consumer needs and habits. As Americans increasingly transitioned into hybrid and work-from-home models, at-home coffee sales received a significant boost. Organic coffee topped the beverage performance chart with more than 5 percent growth and over $2 billion in annual sales.
Breads and Grains
Organic bread and grains sales tapered off slightly in 2021 as the pandemic baking boom subsided, but sales were still strong at $6.2 billion overall. Frozen and fresh breads, the largest subcategory, saw a modest increase of 1.6 percent. Baking ingredients, pastas, rice, and other dry grains saw overall declines. This category may continue to struggle as the war in Ukraine and other serious domestic and international issues constrain supply chains.
Non-Food Products
In this category, fiber, supplements, and personal care products have been the most dominant performers; each saw growth rates of between 5.5-8.5 percent in 2021. Textiles, the largest non-food sub-category, represented 40 percent of the category’s total sales and brought in $2.3 billion in annual sales. Overall, non-food products saw six percent growth in 2021 and represented nearly $6 billion in sales.
“Organic’s ability to retain the market footholds gained during 2020 and continue to grow despite unprecedented challenges and uncertainty is a testament to the strength of our industry and our products,” says Chapman. “To keep organic strong, the industry will need to continue developing innovative solutions to supply chain weaknesses and prioritizing efforts to engage and educate organic shoppers and businesses. OTA is excited to continue serving as a leading voice and champion for organic, particularly as we approach the 2023 Farm Bill.”
The OTA Organic Industry Survey is available in full as an exclusive benefit to association members. To learn more about OTA membership and its benefits, contact Director of Industry Relations, Membership, and Development Cassandra Christine at cchristine@ota.com.
#