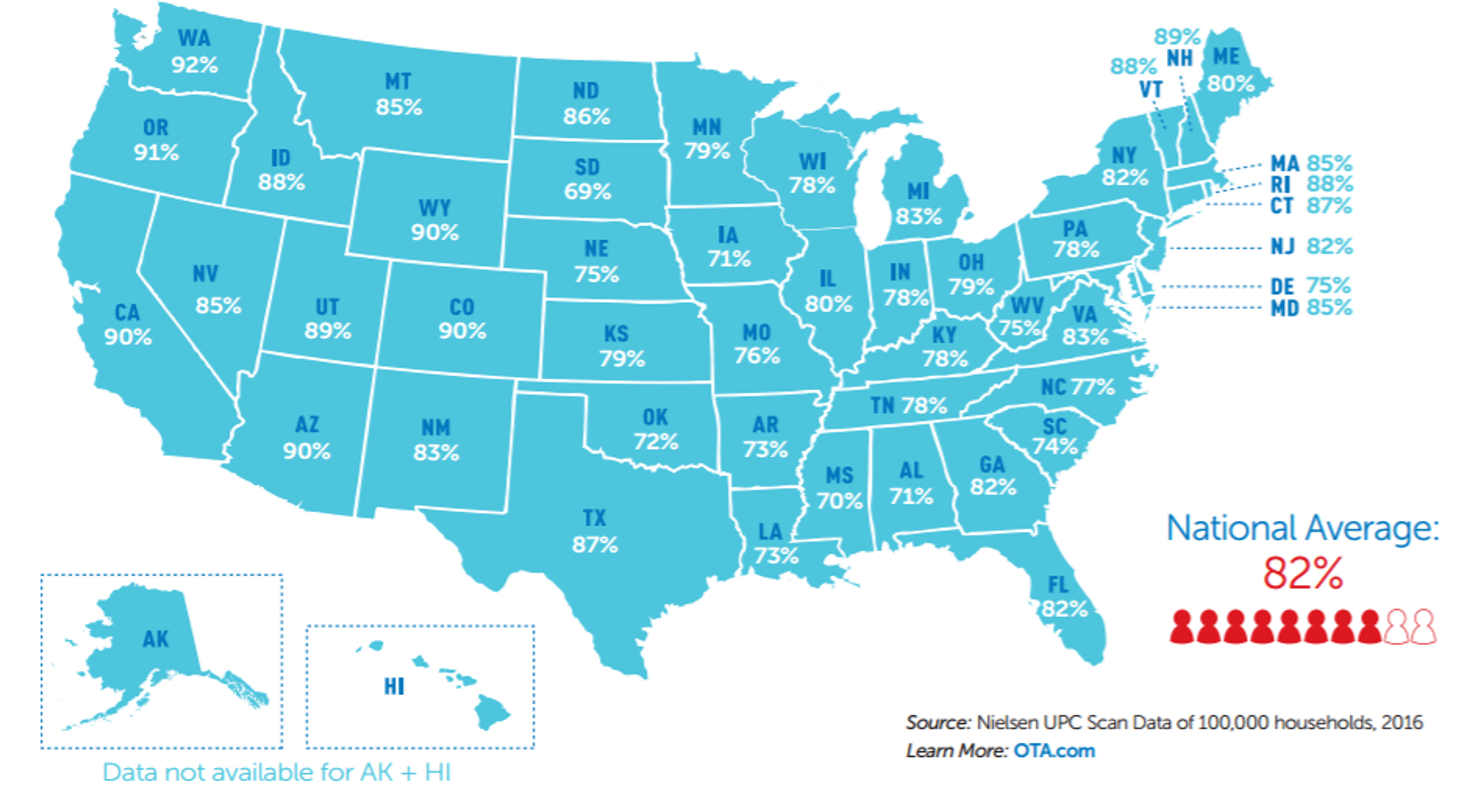
State-by-state data shows increase in organic purchasing throughout U.S.
Organic food can now be found on the shelves of kitchen cupboards and pantries and in the refrigerators and freezers of more than 82 percent of American households throughout the country, according to Nielsen findings released by the Organic Trade Association.
In the first comprehensive look at organic purchases by households on a state-by-state level, 82.3 percent of 100,000 households participating in the nationally representative Nielsen study conducted in 2015 and 2016 reported purchasing organic on a regular basis throughout 2016. That’s up 3.4 percent from 2015.
“These new findings show how important organic has become to millions and millions of American families. There are a number of states in which 90 percent or more of households now buy organic on a regular basis, and even the lowest levels all hover around 70 percent. Organic has made a huge inroad into the diets of the majority of U.S. families, and we expect that healthy trend to just keep getting stronger.” -- Organic Trade Association
The five states seeing the biggest increases in households reporting organic purchases were:
- North Dakota, where 85.6 percent of households participating bought organic in 2016, up 14.2 percent from 2015;
- Rhode Island, with 88.3 percent buying organic, up 12.3 percent from 2015;
- Wyoming, where 90.0 percent of participating households bought organic in 2016, up 10.8 percent;
- South Dakota, which had the lowest percentage of any state at 68.9 percent, but still recorded a 10.0 percent increase;
- Wisconsin, where 77.6 percent of participating households bought organic, up 9.1 percent from 2015.
FREE DOWNLOAD: Map of U.S. Organic Household Purchasing
Organic food sales in the United States now total nearly $40 billion annually and account for around five percent of total food sales in this country.
The Nielsen data comes from 100,000 participating households in the 48 contiguous states that are geographically and demographically diverse to represent the national population. Participating households record with a home scanner all food purchases for in-home consumption from any retail outlet, including organic items. Participants scan the Universal Product Codes (the bar codes that cashiers scan at the supermarket) to track their purchases. Nielsen has been tracking food purchases with its home scanner household panel since 2002.
Contact
|
Market Data Inquiries:
|
|

